1. Introduction
1.1 RNA Velocity
RNA Velocity is a computational method based on single-cell RNA sequencing (scRNA-seq) data, designed to infer the instantaneous transcriptional states and predict future gene expression dynamics of cells. Its core principle involves quantifying the ratio of unspliced (pre-mRNA) to spliced (mature mRNA) transcripts to model transcriptional kinetics, including transcription, splicing, and degradation rates. This enables the prediction of whether a cell is in the induction, steady-state, or repression phases
1.2 Overview of RNAPaceDB
RNAPaceDB is a comprehensive single-cell RNA velocity database that systematically characterizes transcriptional dynamics across disease contexts by integrating 144 independent datasets, spanning 41 disease conditions and analyzing 2,139,640 single cells. Leveraging six computational models (scVelo-Dynamical, scVelo-Stochastic, scVelo_deterministic, DeepVelo-NeuralNetwork, UniTVelo-Unified, and UniTVelo-Independent), the database provides multi-algorithmic RNA velocity profiling while enabling direct comparison of kinetic patterns across different analytical frameworks. All datasets undergo uniform processing including unsupervised clustering via tSNE/UMAP and cell type annotation using Seurat, scType, and SingleR, with subsequent identification of cluster-specific Driver Genes and functional enrichment analysis (GO/KEGG) to reveal disease-relevant pathways. The database offers downloadable velocity matrices (gene-level), cell metadata, and quantitative metrics including pseudotime, velocity length, confidence scores, and latent time measurements. By unifying velocity analysis with static expression patterns and cell state annotations, RNAPaceDB facilitates exploration of transcriptional regulation mechanisms in disease progression, cell fate decisions, and 5,184 precomputed velocity stream plots.
2. Data Integration & Analysis
2.1 Data Sources
RNAPaceDB integrates single-cell RNA-seq (scRNA-seq) datasets exclusively from the Gene Expression Omnibus (GEO), ensuring standardized data quality and metadata annotations. The current release comprises 81 GSE Series, spanning 144 independent experiments across diverse disease conditions, tissue types, and developmental stages.
2.2 Data preprocessing
Read raw data: Utilize CellRanger 7.1.0 to read the original data in fastq format. This step is crucial as it accurately captures sequence information from each cDNA fragment in the data, laying the foundation for subsequent analyses. The command for running CellRanger count is: cellranger count --id=sample_name --transcriptome=/path/to/transcriptome --fastqs=/path/to/fastq_files.
Quality control: Employ the Seurat 4.0.2 package in R to perform quality control. During this process, several key metrics are evaluated:
Cell filtering: Remove cells with less than 200 genes per cell as these are likely to be low-quality cells or debris. Filter out cells with more than 20% mitochondrial gene reads as this often indicates damaged or dying cells.
Gene filtering: Discard genes expressed in less than 3 cells to reduce noise and focus on genes relevant for downstream analysis.
Alignment and counting: CellRanger 7.1.0 maps the reads to the reference genome. It aligns the reads and counts the number of reads that map to each gene, generating a raw gene expression matrix. When using the human genome build GRCh38, CellRanger uses pre-built indices for this genome to perform the alignment efficiently.
Doublet detection: Use DoubletFinder 2.0 to identify and remove doublets. The process involves generating simulated doublets from the existing single-cell data, combining them with the original data, performing preprocessing steps including normalization, finding variable genes, and PCA, and then calculating the proportion of artificial nearest neighbors (pANN) for each cell. Cells with a pANN value above the expected doublet rate threshold are flagged as doublets and removed from the dataset.
Normalization: Apply the NormalizeData function in Seurat 4.0.2 to normalize the gene expression matrix. This step corrects for differences in sequencing depth between cells, allowing for fair comparison of gene expression levels across different cells. The log-normalization method stabilizes the variance across genes and cells.
| Step | Tool/Method | Version |
|---|
Table 1: Data preprocessing in RNAPaceDB
2.3 RNA Velocity Analysis Method
Our RNA velocity analysis integrates three major computational paradigms, spanning from classical mathematical modeling to modern deep learning approaches: (1) Differential equation-based models (scVelo's dynamical/stochastic/deterministic modes) employing likelihood optimization to resolve transcriptional kinetics; (2) Unified tensor frameworks (UniTVelo) that simultaneously model splicing kinetics and cell-state transitions through constrained optimization; and (3) Neural network architectures (DeepVelo) utilizing autoencoders to learn high-dimensional velocity patterns directly from single-cell data.
| Model | Method Type | Version | Parameter_settings | References |
|---|
Table 2: RNA Velocity Analysis Method in RNAPaceDB
We utilized six distinct computational models, implemented across three computational methods, to derive RNA velocity profiles: scVelo_Deterministic, scVelo_Dynamical, scVelo_Stochastic, UniTVelo_Unified, UniTVelo_Independent, and DeepVelo.
scVelo infers velocity by distinguishing unspliced and spliced mRNA dynamics, with three models optimized for varying assumptions about transcriptional “steady-state” vs. “dynamic” regimes:
scVelo_Dynamical:
This model efficiently estimates RNA velocity by quantifying how the observed unspliced-spliced mRNA ratio deviates from steady-state equilibrium. It operates under the key assumption that transcriptional phases are sufficiently long for cells to approach this equilibrium, with equilibrium levels approximated via linear regression on the lower and upper quantiles of presumed steady-state cells. It is applicable to biological contexts where the transcriptional phase is long enough to approach a steady-state equilibrium. For example, in the process of embryonic stem cell differentiation, when the cells are in a relatively long- term differentiation stage and the transcriptional process has enough time to reach a near-equilibrium state, the scVelo_Dynamical model can be used to analyze the RNA velocity to understand the dynamic changes of cells during the differentiation process.
scVelo_Stochastic:
This model is computationally expensive and solves the full splicing kinetic dynamics for each gene, and it can adapt to diverse scenarios like non -stationary populations by avoiding restrictions such as a common splicing rate or the need for sampled steady states. It is very suitable for biological scenarios with high-complexity and non-stationary cell populations. For example, in the study of tumor microenvironments, where there are a large number of heterogeneous cells, and the cell states are constantly changing, the scVelo_Stochastic model can be used to analyze the RNA velocity of different genes in each cell, so as to better understand the dynamic changes of tumor cells and the surrounding microenvironment cells.
scVelo_Deterministic:
This model designed to better capture steady states by treating transcription/splicing/degradation as probabilistic events, approximating the resulting Markov process via moment equations that incorporate second-order moments to leverage both unspliced-spliced mRNA balance and their covariation. It is suitable for biological scenarios where the system is relatively close to a steady state, such as the study of certain adult tissues with relatively stable cell populations. For example, in the research of normal liver tissue cell populations, where the transcriptional and splicing processes of cells are in a relatively stable state with minimal fluctuations, the scVelo_Deterministic model analyzes RNA velocity to more accurately reflect gene kinetic changes in this stable state.
UniTVelo is a statistical framework for RNA velocity inference that models the dynamics of spliced and unspliced RNAs via a top-down design using radial basis functions (RBF), enabling flexible transcription activity profiling; it uniquely introduces a unified latent time across the transcriptome to resolve directional discrepancies between genes, with support for both unified-time and independent modes to adapt to diverse biological datasets.
UniTVelo_Unified:
This model employs a gene-shared latent time across the transcriptome, aggregating dynamic information from all genes to reinforce temporal cell ordering, and is particularly effective for datasets with genes lacking strong kinetic traits. It is suitable for biological contexts where the kinetic characteristics of genes are not obvious or the data is relatively noisy. For example, in the study of some rare cell types, due to the limited number of cells and the possible lack of obvious kinetic characteristics of genes, the UniTVelo_Unified model can be used to integrate the information of all genes to analyze the RNA velocity and then infer the cell development trajectory.
UniTVelo_Independent:
UniTVelo_Independent: This model assigns gene-specific latent times, allowing greater flexibility for complex datasets with high signal-to-noise ratios, such as those containing cell cycles or sparse cell types. It is suitable for biological scenarios with complex gene expression patterns and high signal-to-noise-ratio data. For example, in the study of cell cycle-related biological processes, different genes may have different expression patterns at different stages of the cell cycle. The UniTVelo_Independent model can assign specific latent times to each gene according to its expression characteristics, so as to more accurately analyze the RNA velocity of genes during the cell cycle.
DeepVelo:
This method is a deep learning-based framework that models continuous-time single-cell transcriptome dynamics using neural ordinary differential equations (ODEs), where a variational autoencoder (VAE) learns nonlinear gene regulatory relationships to map gene expression states to RNA velocity, enabling the prediction of future cell states via ODE integration. It can capture complex nonlinear gene interactions, so it is very suitable for biological scenarios that require accurate prediction of cell future states and involve complex nonlinear gene regulatory relationships. For example, in the study of embryonic development, the differentiation process of cells is regulated by a large number of genes, and there are complex nonlinear interactions between these genes. The DeepVelo model can be used to accurately predict the future development direction of cells and help researchers better understand the molecular mechanism of embryonic development.
2.4 Data Analysis
The data analysis pipeline of RNAPaceDB centers on multi-dimensional transcriptional dynamics profiling, comprising the following key steps:
Multi-algorithmic RNA velocity computation:
Using six computational models (scVelo-Dynamical, scVelo_deterministic, scVelo-Stochastic, DeepVelo-NeuralNetwork, UniTVelo-Unified, UniTVelo-Independent), RNA velocity is calculated in parallel based on preprocessed single-cell data. This covers approaches from differential equation modeling and deep learning to unified tensor frameworks, enabling multi-dimensional characterization of transcriptional kinetics.
Cell state clustering and annotation:
Unsupervised clustering is performed via tSNE/UMAP, followed by cell type annotation using Seurat, scType, and SingleR tools, systematically partitioning cellular heterogeneity across diverse disease contexts.
Driver gene identification and functional enrichment analysis:
Cluster-specific Driver Genes are identified for each cell cluster, and GO/KEGG enrichment analyses are conducted to mine disease-related signaling pathways, unraveling transcriptional regulatory mechanisms.
Quantitative metrics generation and visualization:
Kinetic metrics including pseudotime, velocity length, and confidence scores are generated, alongside velocity matrices for 4,380 precomputed velocity stream plots, supporting quantitative analysis and visual exploration of transcriptional dynamics.
Multi-dimensional data integration:
RNA velocity analysis results are deeply integrated with static gene expression patterns and cell state annotations, providing a systematic framework for studying cell fate decisions and heterogeneity during disease progression.
3. User Guide
3.1 Data Query
RNAPaceDB provides both quick search and advanced filtering functionalities for data queries. The quick search supports keyword-based retrieval using gene names, disease terms (including DOID and TCGA codes), tissue/organ names, or GSE accession numbers. The advanced filter enables combinatorial queries across multiple dimensions, allowing users to precisely search by disease type, data time range, GEO project ID, tissue origin, cell line, and RNA velocity analysis models. All query results can be previewed in real-time and exported for further analysis.
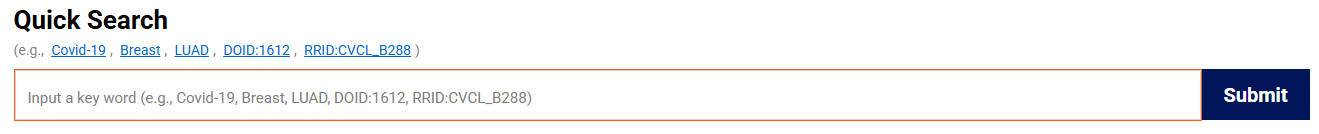
Figure 1: Quick search interface in RNAPaceDB
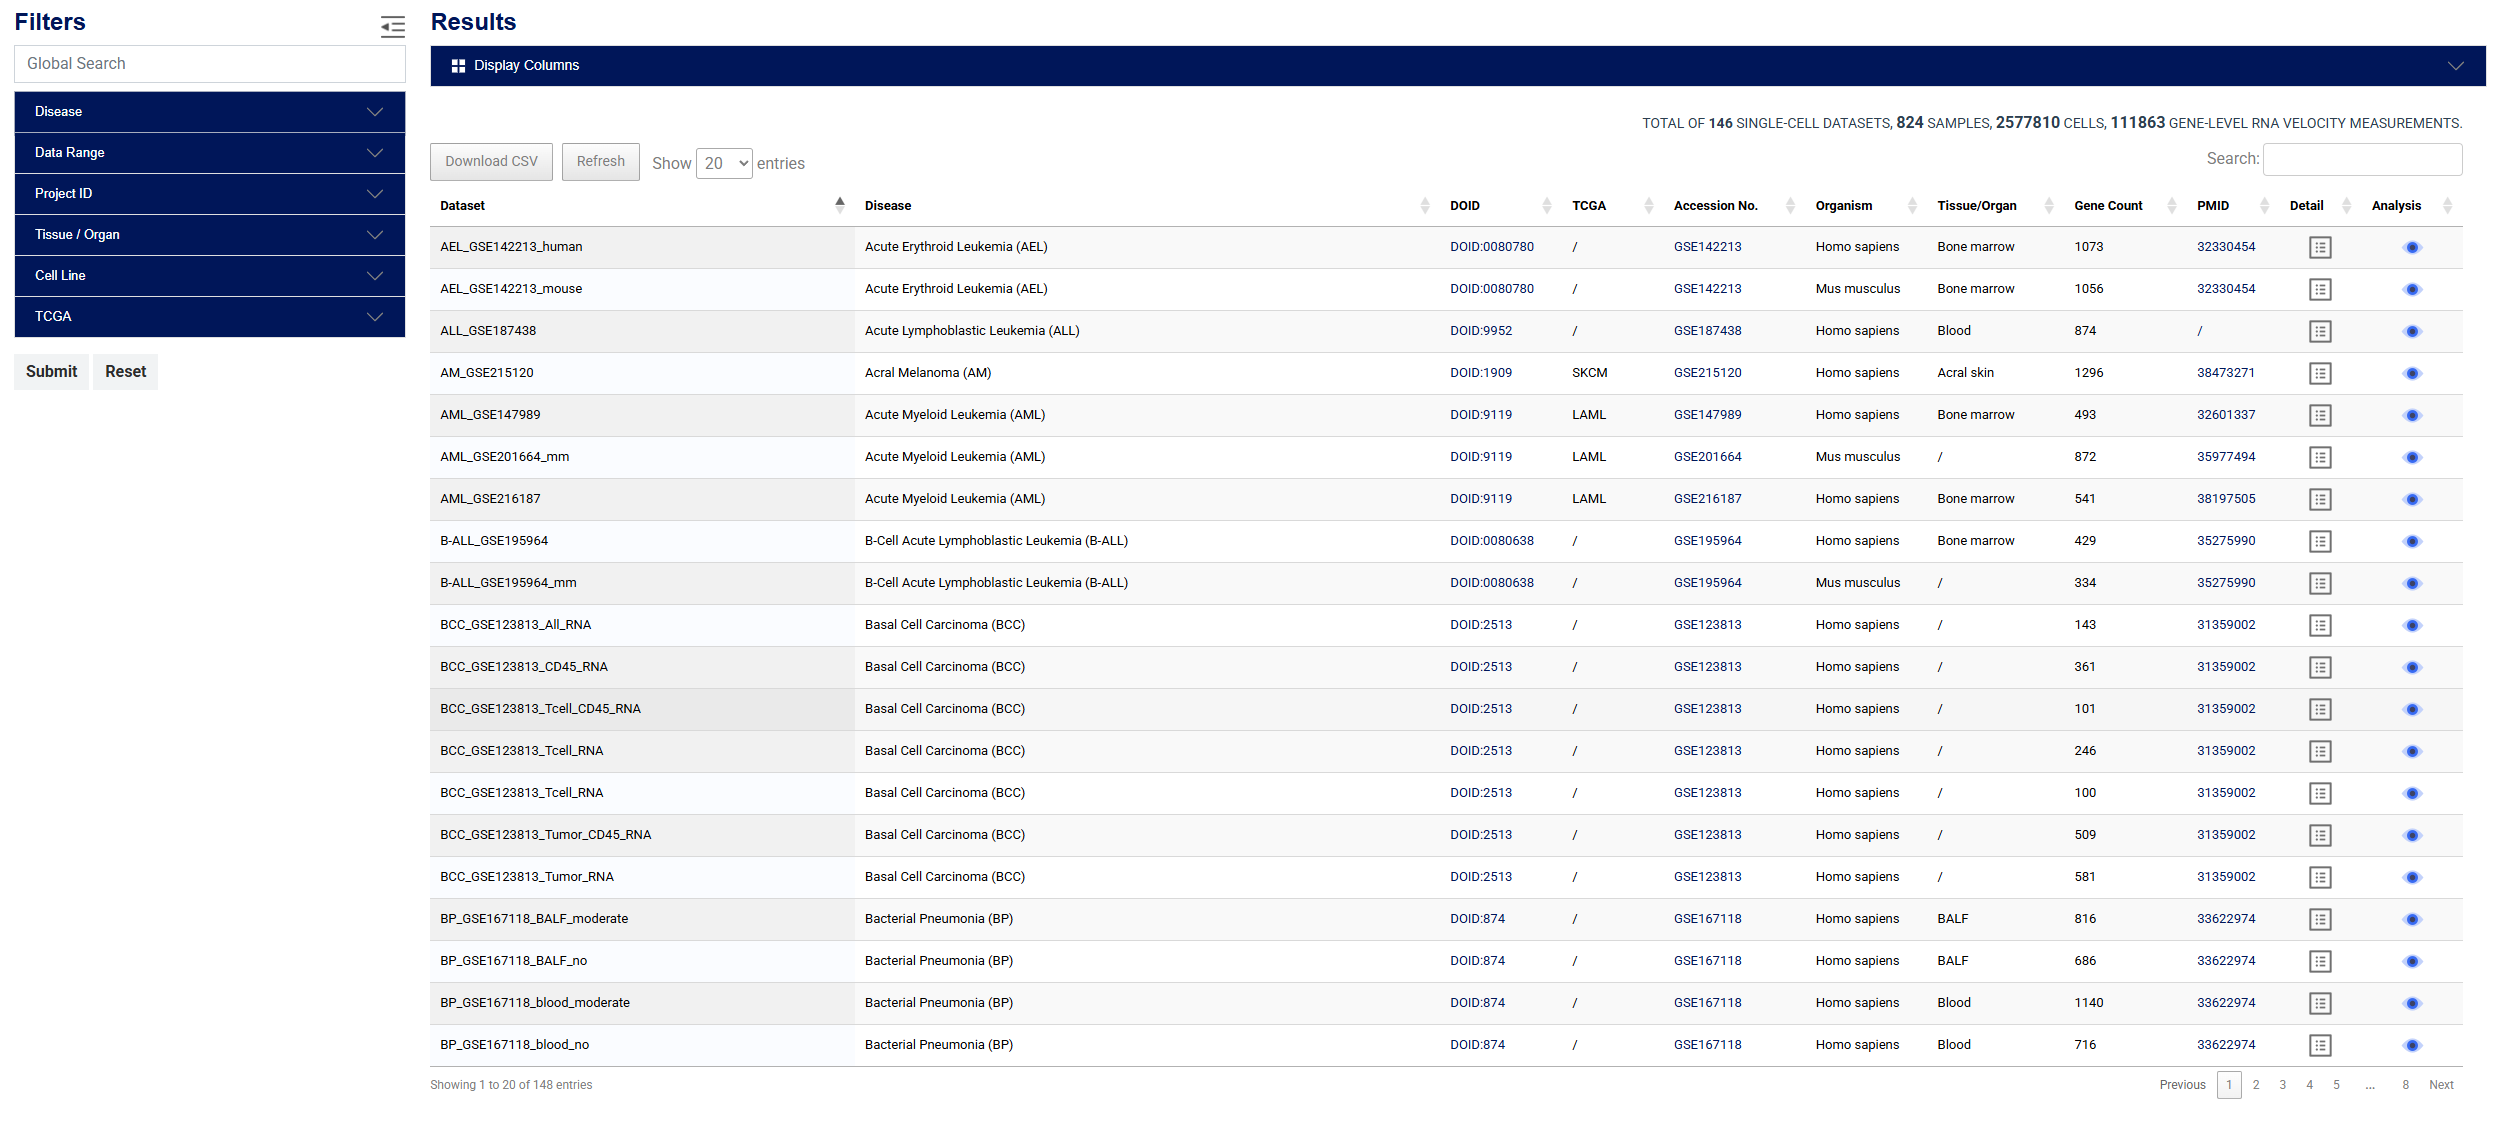
Figure 2: Advanced filter interface in RNAPaceDB
3.2 Online Analysis Tools
We have categorized the analytical functions into four sections:Dataset, Gene, Cell and Function. Click the "Velocity Analysis" button in the navigation bar to explore further analyses.
Velocity Analysis for diseases, tissues, or organs to obtain corresponding datasets. Click the "Explore" chart to get visualized results.
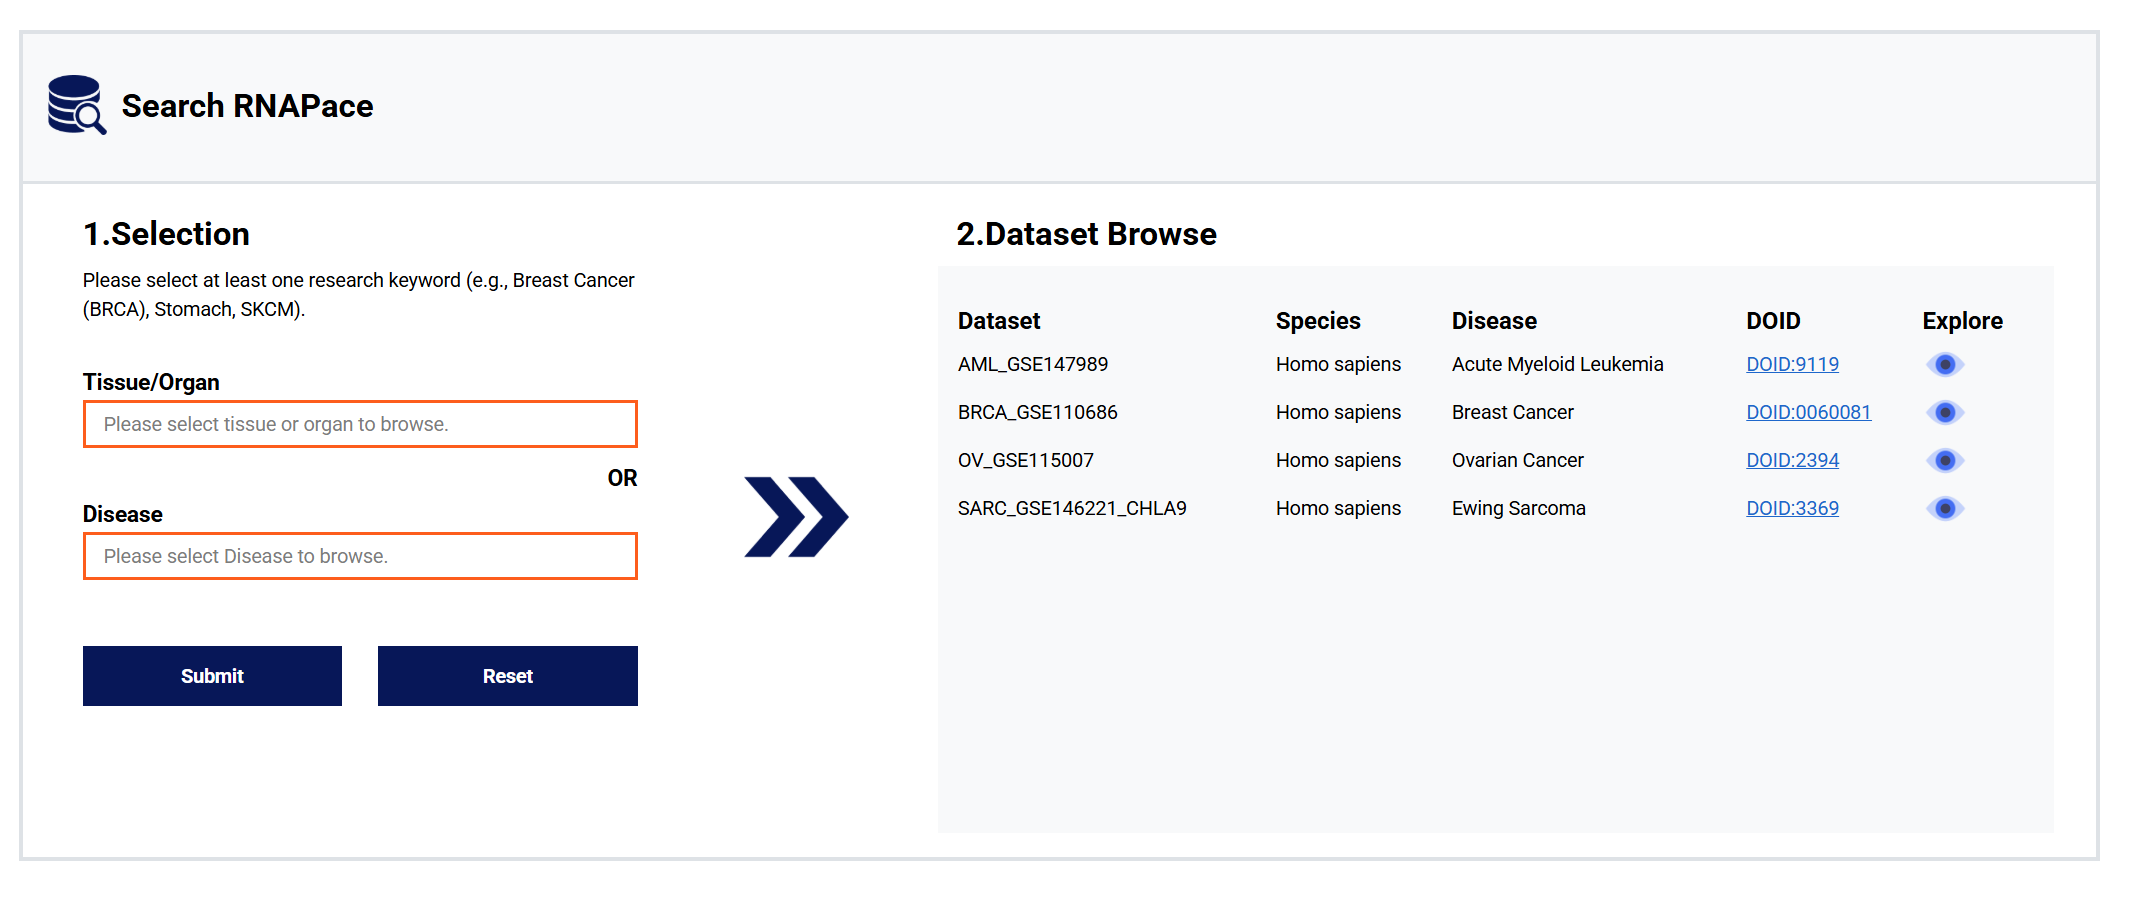
Figure 3: Velocity Analysis RNAPace module
Dataset moudule:
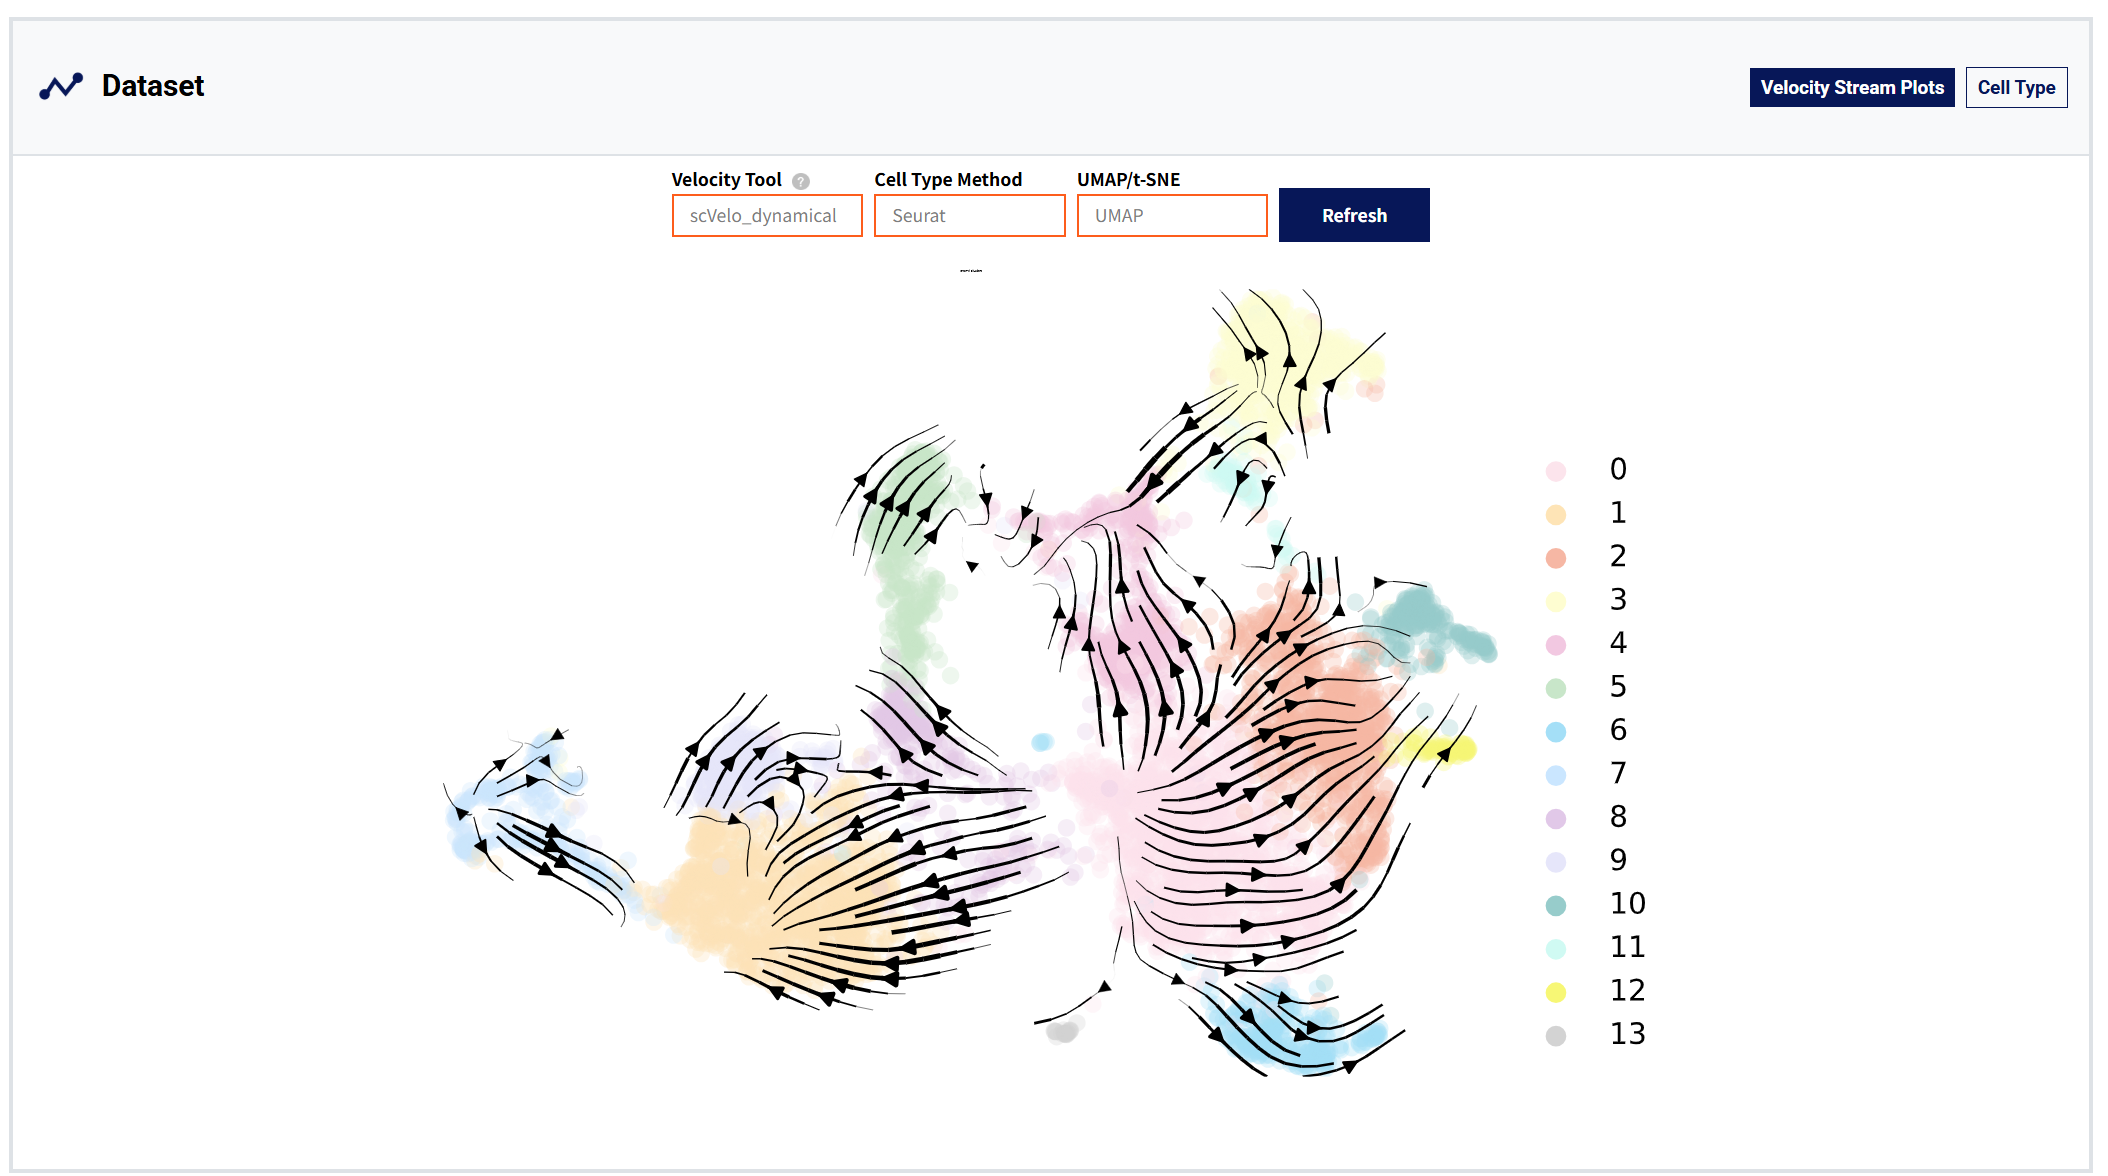
Figure 4: Dataset module
Gene moudule:
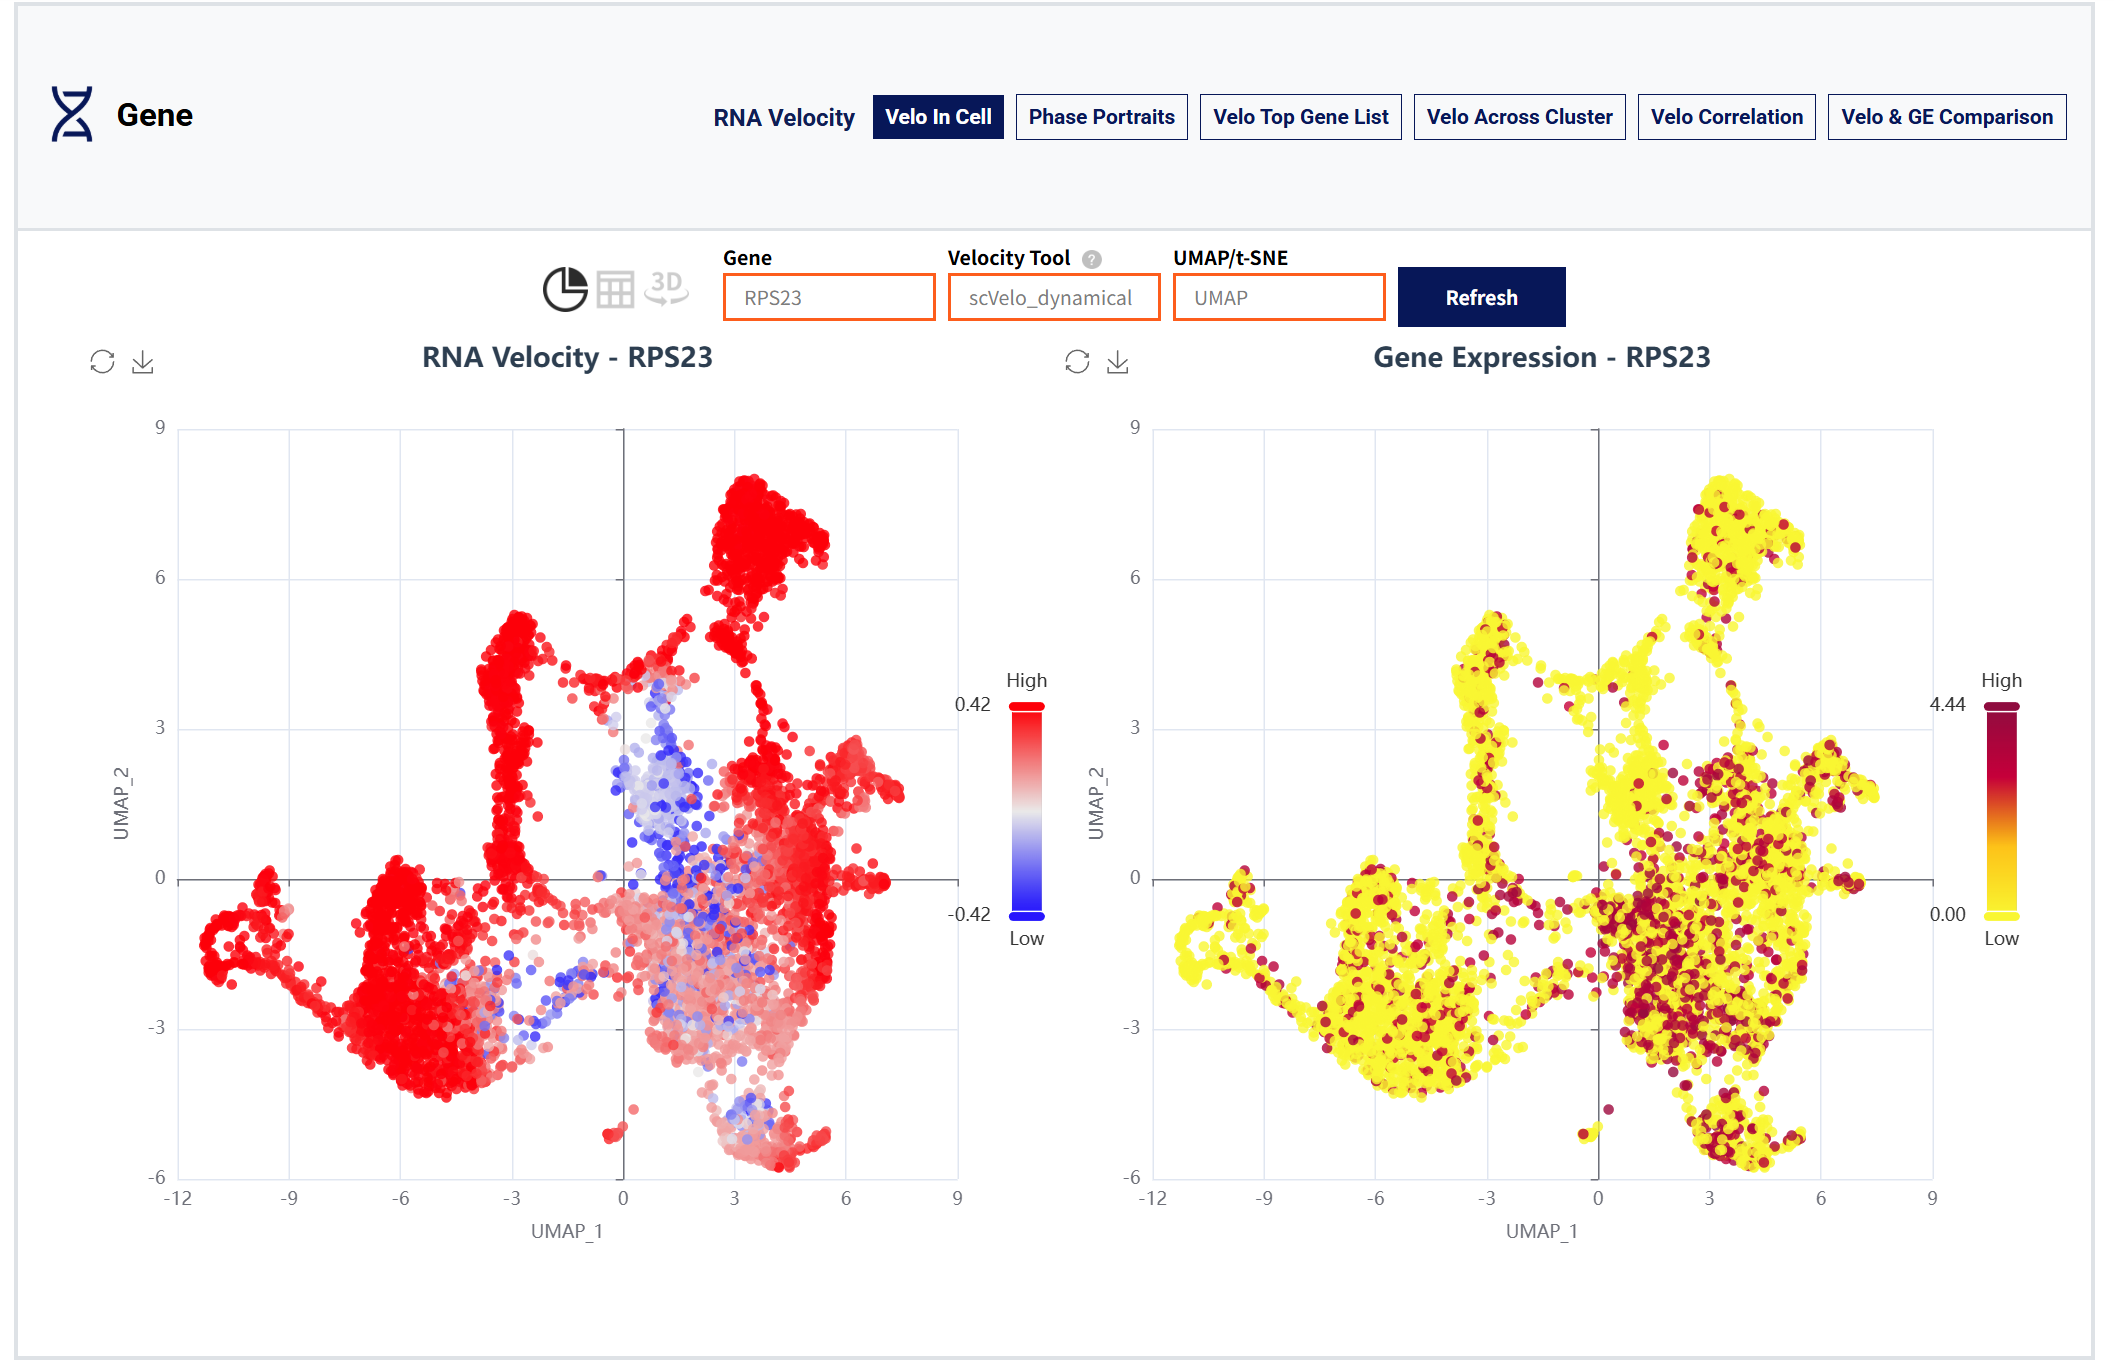
Figure 5: Gene moudle
Cell moudule:
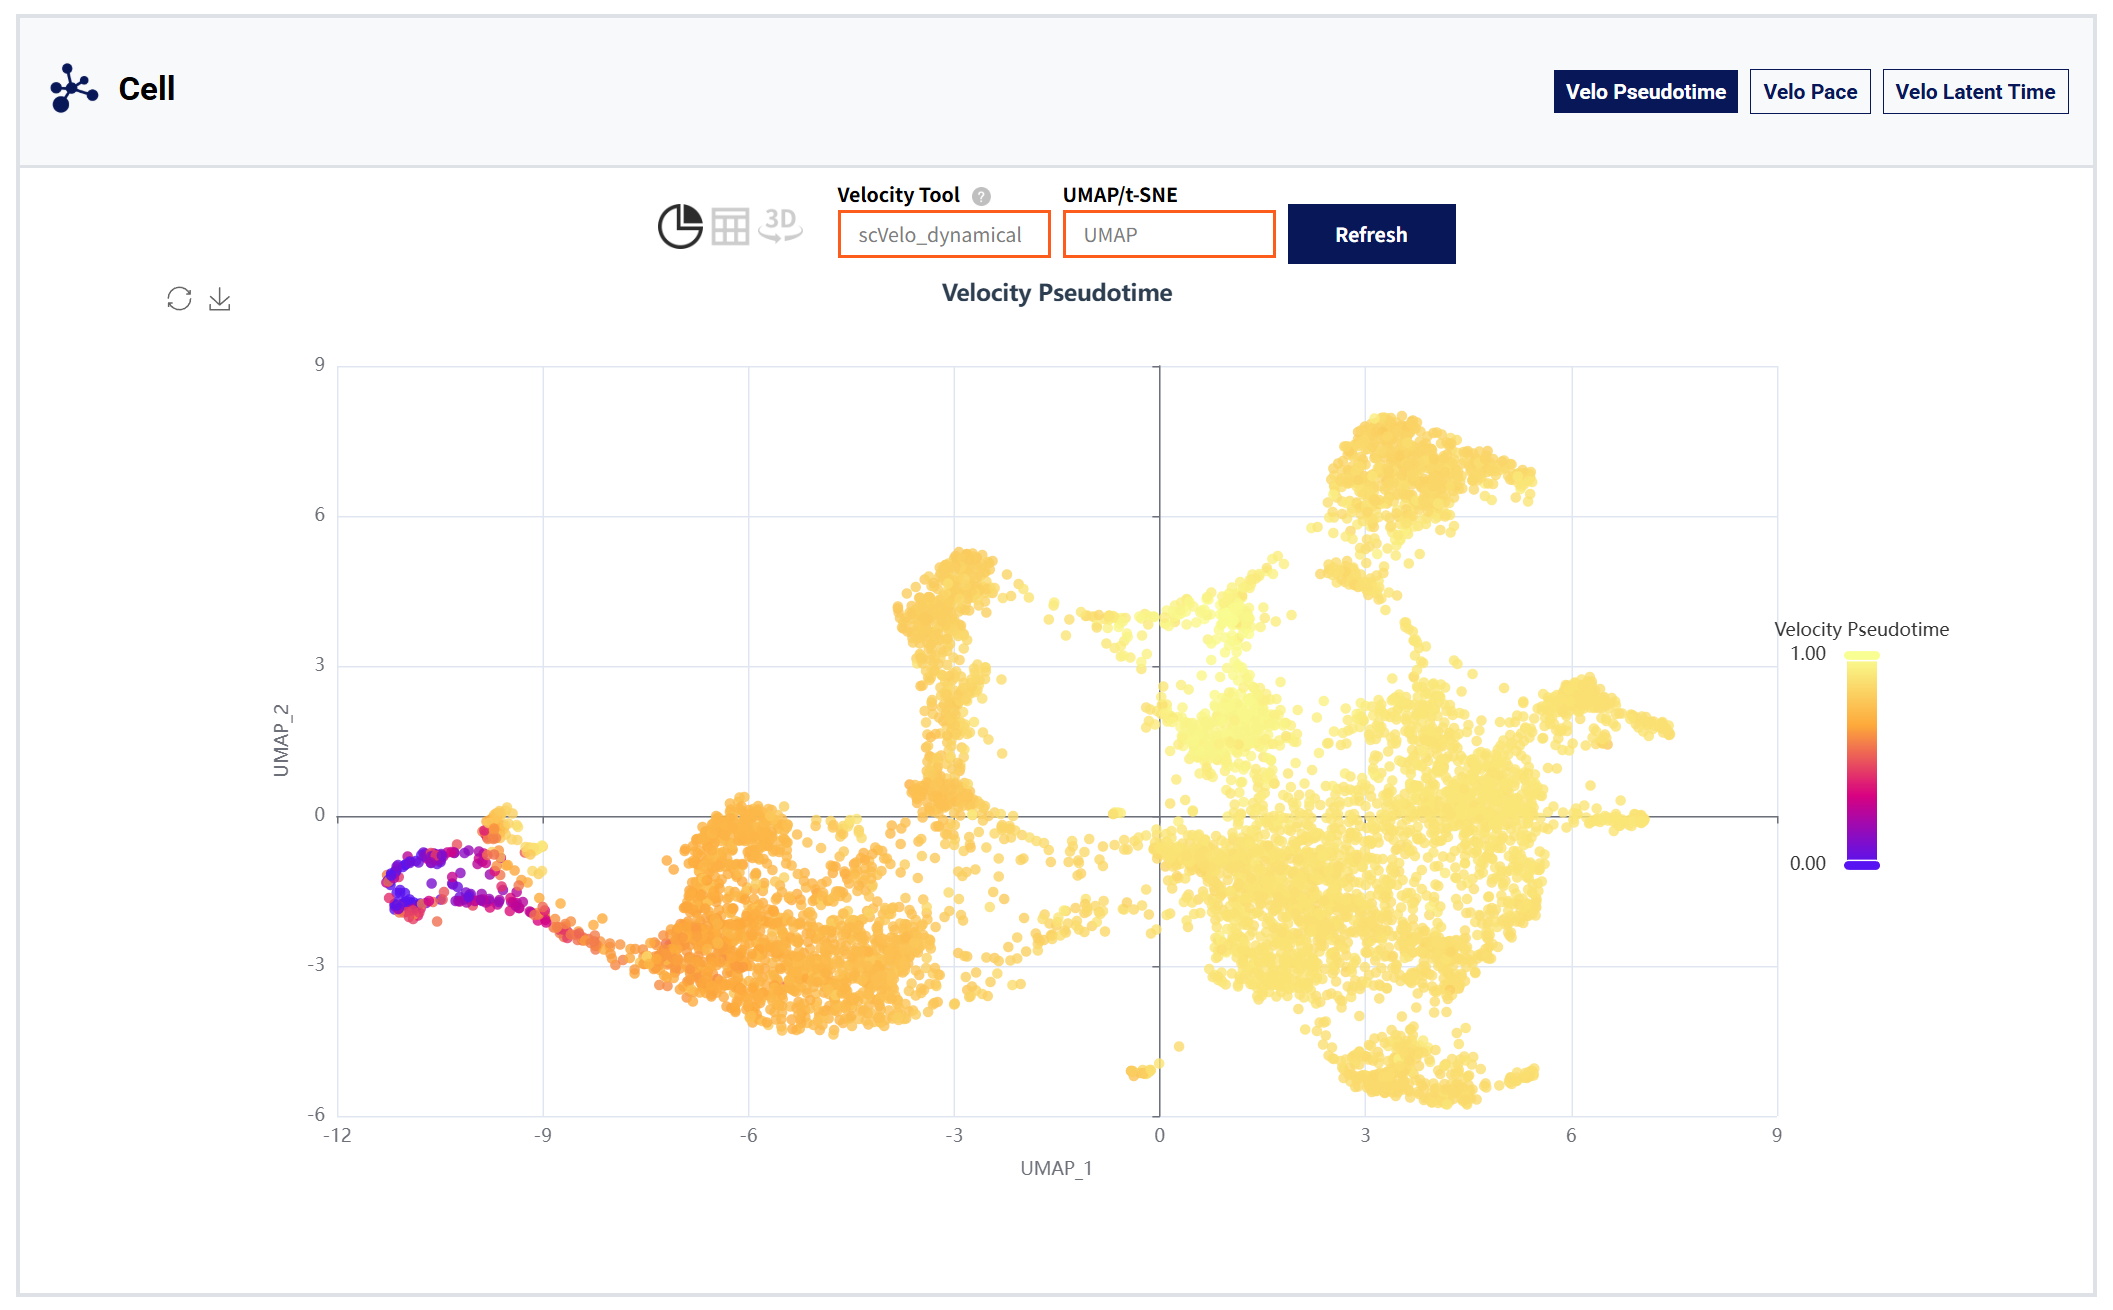
Figure 6: Cell module
Function moudule:
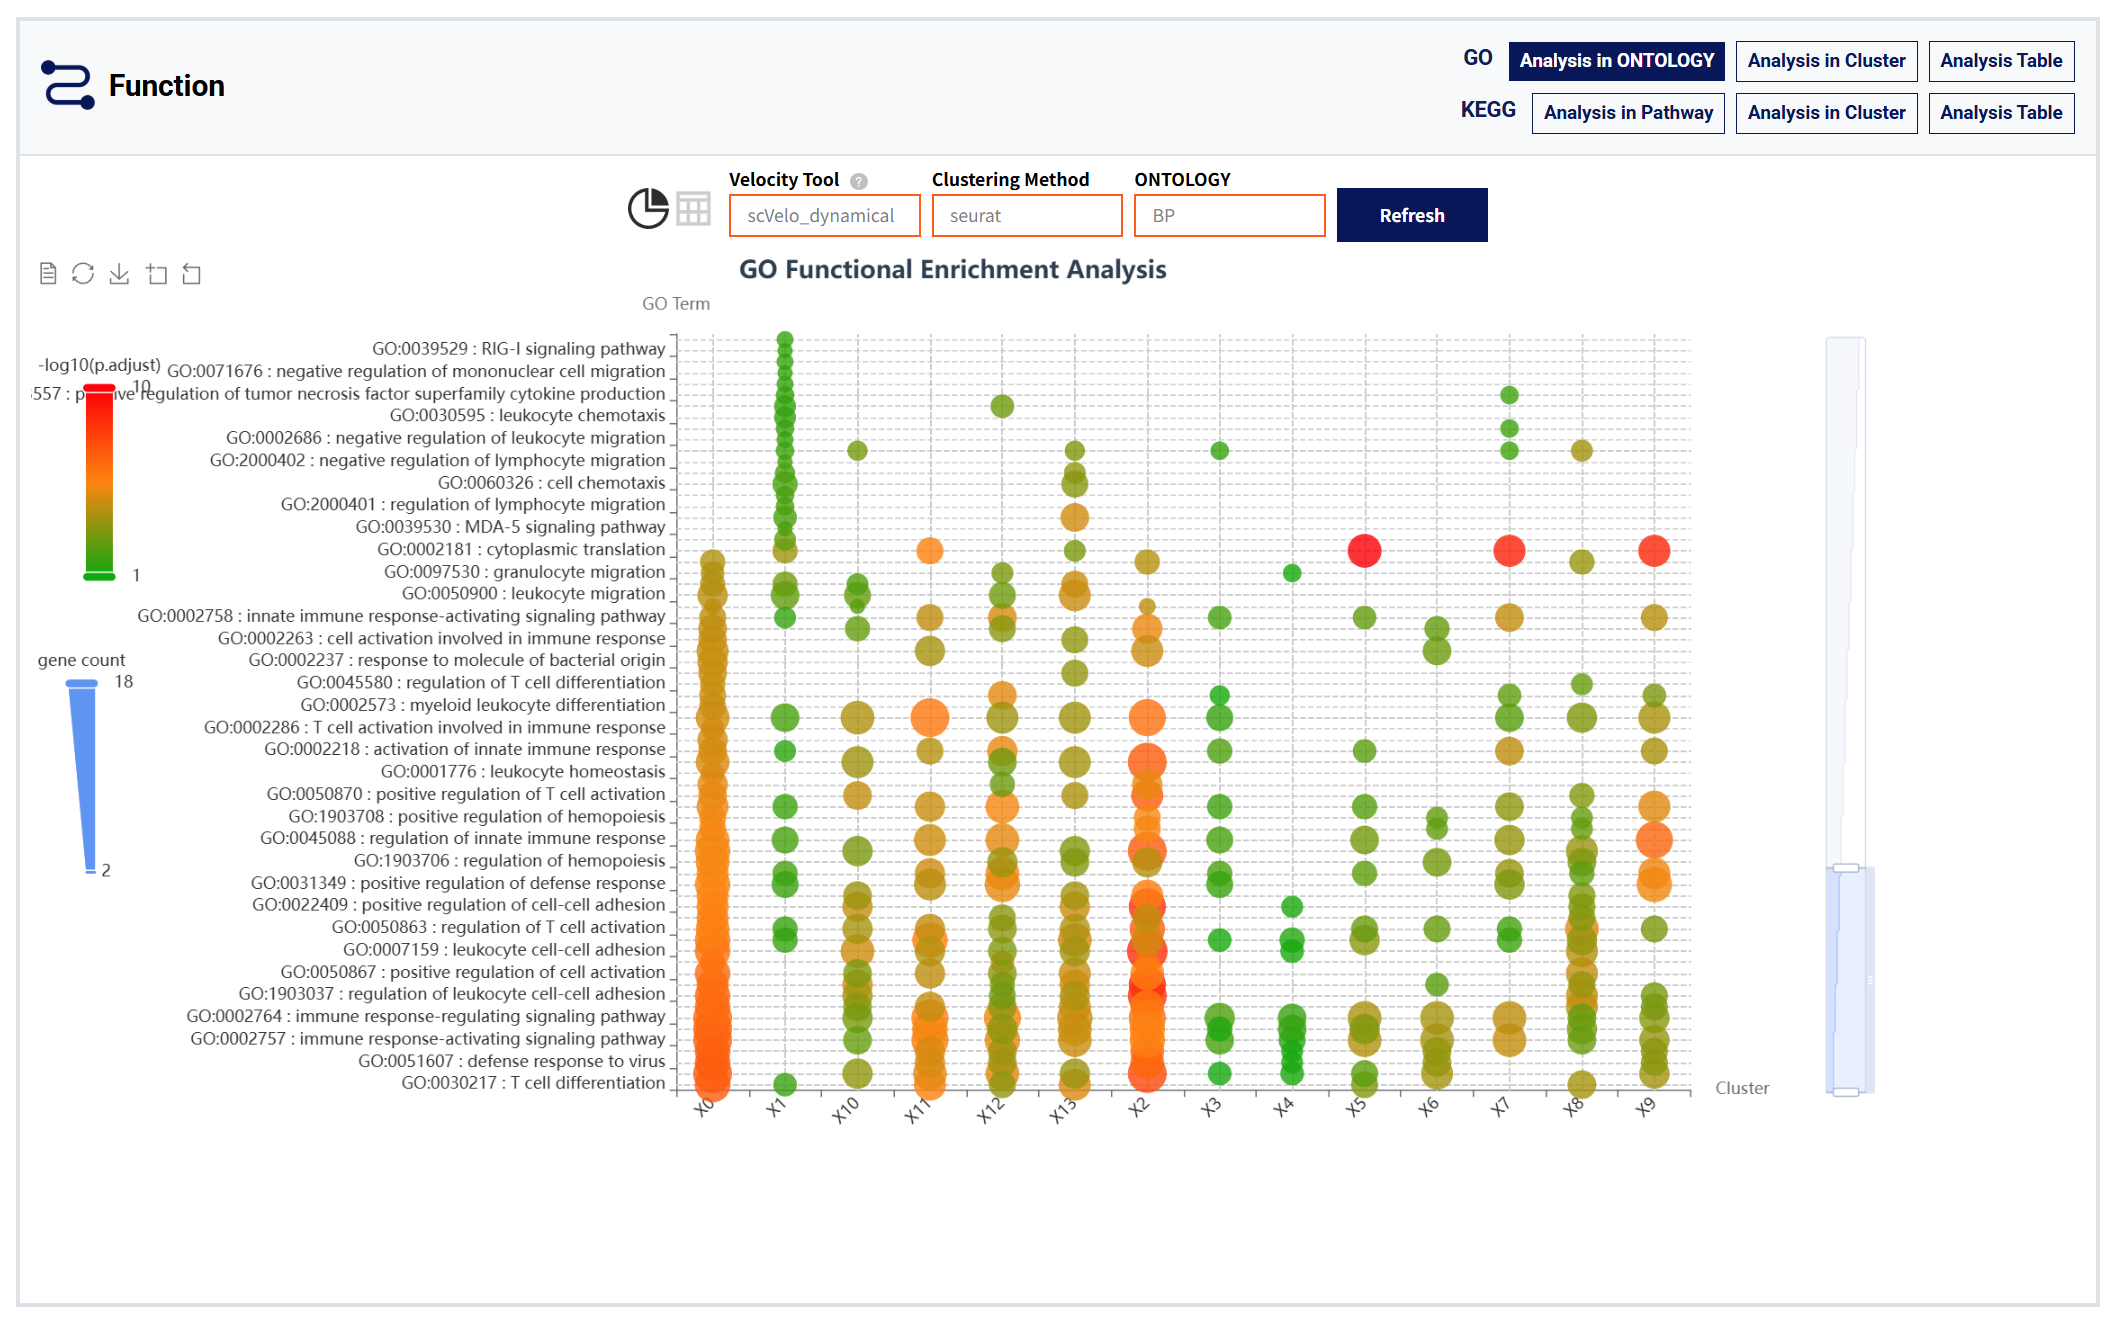
Figure 7: Funtion module
3.3 Data Download
RNAPaceDB provides comprehensive RNA velocity data for download, organized into three main categories: (1) Gene RNA Velocity Matrices containing cell-by-gene velocity values computed using six distinct computational models (scVelo-Dynamical/Stochastic/scVelo_deterministic, DeepVelo, and UniTVelo-Unified/Independent); (2) Cell Metadata and Gene Lists featuring annotated cell-type information and complete gene identifiers; and (3) Velocity Metrics including pseudotime, velocity length, confidence scores, and latent time measurements. All data is provided in standardized CSV format (compressed as .zip files) with consistent naming conventions across datasets. Users can easily search and filter available files by GEO accession number or dataset name.
4. Contact Us
Email: wangsy@hrbmu.edu.cn
Address:
Harbin Medical University
No. 157 Baojian Road, Nangang District
Harbin, Heilongjiang Province
China, 150081